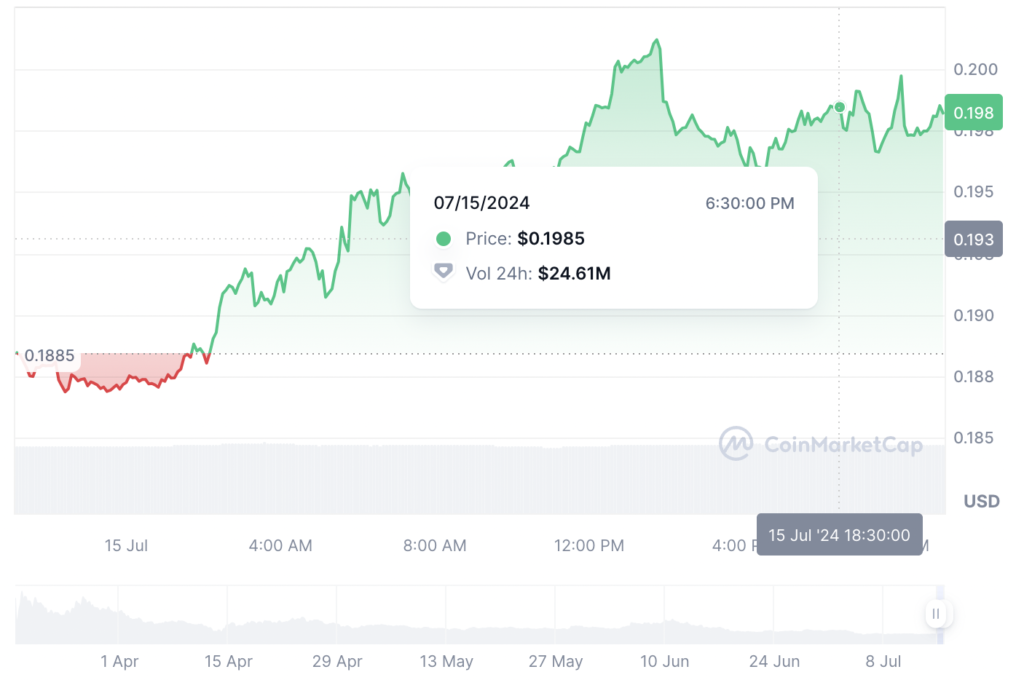
Slerf’s (SLERF) price surged after a long weekend, with the token surging 5% in the last 24 hours to trade at $0.1984 during European trading hours. Immense volume supports the price surge, up 5% daily to $24 million. This sudden interest in Slerf also positively impacts its market capitalization, which, according to CoinMarketCap, is up 5% to $99 million. Slerf ranks #357 among other cryptocurrencies.
What is Slerf?
Slerf(SLERF) is a Solana-based memecoin featuring a drooling sloth. It is used for trading, leveraging its meme coin status and community backing to drive market activity. Since its launch, the SLERF token has increased consecutively. This comes as the project team accidentally burned about $10 million worth of tokens.
Despite the burn, Slerf’s price surged. The token’s market cap soared to an all-time high of $750 million. This made the memecoin gain a spot among the most significant Solana-based meme coins.

After hitting an all-time high of $1.3 from the launch price, SLERF began to retrace and is currently at $0.1984, up by 5.30%.
Meanwhile, Slerf still enjoys the title of being the most liquid meme coin on Solana and has continued to secure partnerships across the Solana globe. Recently, every Slerf holder has qualified for points in The AllDomains Experience. AllDomains is a Web3 identity asset layer for creating and trading Web3 domains.
Meanwhile, it is not too late to join the Slerf family. The tokens can be traded on centralized crypto exchanges, including Bitget. Its most active trading pair, SLERF/USDT, has a trading volume of $5 million in the last 24 hours. Notably, Bitget has taken to the X platform, noting that according to the spot fee of SLERF/USD pair in June, it will donate 143.86SOL to support the pre-sale participants’ refund.
Slerf Technical Outlook Suggests Bullish Sentiment
The Slerf sellers seem to have capitalized on a death cross formed around $0.2505 on July 3, driving the Slerf price downward. The token fell like a dead weight in the air with no strong guards to keep the bearish sentiments in check. However, the bulls gathered some stamina at around the $0.1672 support level, regaining composure to prevent further downward losses.
This has led to a tug-of-war between the bulls and the bears, forcing the Slerf price into a consolidation phase. Over the past few days, the SLERF price has been stuck in a tight range, with the upper limit/resistance at $$0.2018 and the lower limit/support at $0.1749.
This moving period between horizontal support and resistance levels may act as an accumulation period before the bulls initiate a strong move upward. Based on the technical Information, there is a tug-of-war between the bulls and the bears. However, the odds favor the upside.
The Slerf price trades well above the 50-day Simple Moving Average(SMA)(green) and the 200-day Simple Moving Average (SMA) (blue). In this scenario, the SLERF bulls have turned the $0.1911 and $0.1887 into immediate support levels, painting the SLERF Market bullish.
Dextools.io: SLERF/USD 1-hour chart
Moreover, the Relative Strength Index(RSI) is well above the mean level of 50, with its strength at 59, suggesting intense buying pressure. Increased buying pressure will see the RSI jump to the 70-overbought zone, validating the bullish thesis in the market.
Many golden cross-indexes are in line and support the bullish outlook. A golden cross is an index on the chart when a short-term moving average flips above a long-term moving average, convincing market participants that the path with the least resistance is to the upside.
The Moving Average Convergence Divergence (MACD) indicator backs the bullish outlook on the one-hour chart timeframe. The buy signal appeared, with the blue MACD line crossing above the red signal line. The cross above the signal line suggests that the short-term moving average rises faster than the long-term moving average.
According to CoinCodex’s price projection, SLERF is expected to trade between $0.198031 and $0.936005 during the next year. Should SLERF achieve its upper-value target by 2025, it would represent a 369.11% increase, amounting to $0.936005.
Most traders usually identify this technical occurrence as indicating that the token has entered a positive cycle. Moreover, traders and investors are inclined to continue buying SLERF unless the trend in the MACD changes.
Slerf Price Outlook
According to the one-hour chart analysis, SLERF’s price trades bullishly, with seller momentum dwindling. If the buyers take advantage of the golden cross formed at around $0.1894, the SLERF bulls could trigger a bullish rally, targeting the $0.2634 technical barrier. In a highly bullish scenario, the SLERF price could eye the $0.30 mark in the coming days.
Conversely, if the sellers step in and the crypto market turns negative, the SLERF bears could breach the $0.1911 support, invalidating the bullish thesis. In a dire case, the price could slump below the consolidation channel, retesting the $0.1659 support level.


