As the cryptocurrency behind Binance, BNB has hit a crucial level of resistance, leading concerns of a price correction ahead. Momentum stalls after strong rally puts asset at a critical juncture.
According to bears, the $605 resistance level was a tough barrier to penetrate with selling pressure heightening as they flood into the market. Brokers are now keeping close tabs on whether or not this is the beginning of a price correction whereby prices drop, or if the bulls can come back to the fight and lift the prices higher again.
BNB Faces Key Rejection
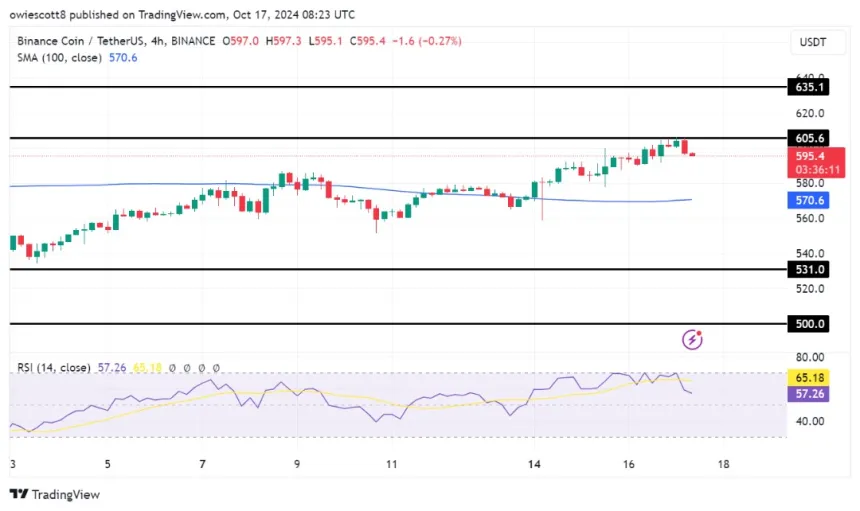
At $605, BNB has found rejection, reentering bearish territory on the 4 hour chart and retreating towards the 100 day Simple Moving Average (SMA). The Relative Strength Index (RSI) also supports the momentum move lower with the index falling to 57% after going overbought. This tells us that buyers are losing steam so the bullish momentum has started to wane.

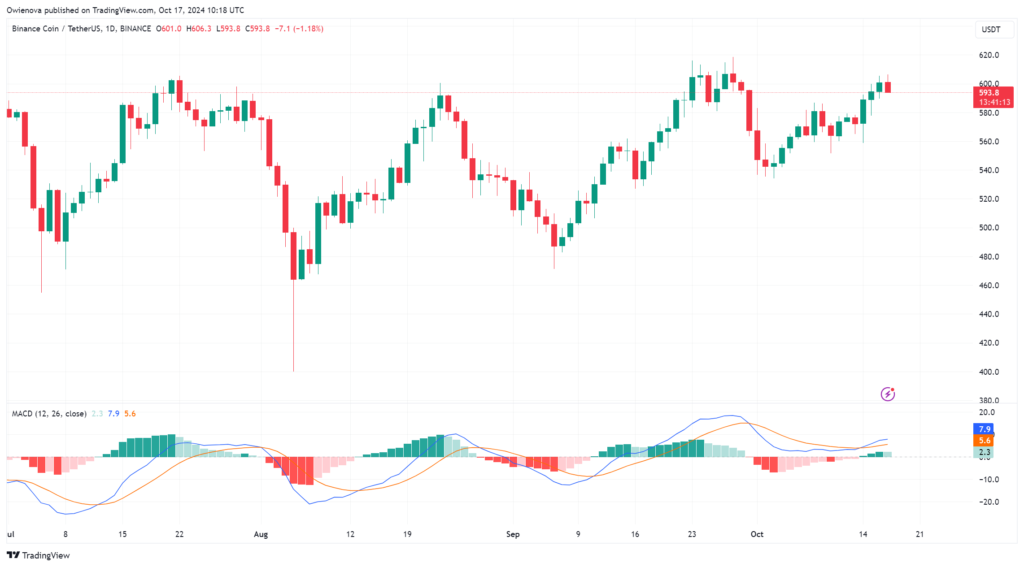
Despite the fact that the price remains above the 100 day SMA, a bearish candlestick has formed on the daily chart. If BNB cannot hold this level, a larger decline could follow. Although mostly bullish on the timeframes, the RSI on daily chart shows a dip to 69%, which also suggests that the upward momentum has waned.

We should watch for support at $531, where buying interest might defend a more serious correction. If a break happens below this support, selling pressure will intensify bringing BNB down to $500 or lower. On the flip side, if bulls push the price northward above $605, we could witness BNB reaching further resistance at $635, which could cause more growth.
The market is skewed towards a direction of BNB’s short term, and traders are closely focusing on these key levels.


