Christopher Inks, an established crypto expert, has released his latest technical analysis, which points to a possible beneficial move for Bitcoin.
Inks’ analysis indicates the appearance of an Adam and Eve double bottom pattern on the BTC/USD 1-hour chart. This pattern has important effects for the cryptocurrency’s price movement in the near future.
The pattern, which can be seen as two troughs divided by a peak, shifts in unique ways. The first decline, which has been called the Adam, resembles a sharp, V-shaped bottom. This means that prices dropped rapidly and then rose promptly again. After that, the Eve trough shows up with a more fluid, more gradual shape, indicating a slower, more careful rise in price.
A vital component of Inks’ research is finding a key price level, which he does by drawing a horizontal yellow line. He states that this line is the neckline of the pattern.
If prices break through and then close above this level, which is around $67,000, it would confirm the pattern and could mean the start of a bullish turnaround.
Bitcoin Bullish Trend Highlighted
To find the subject of the pattern, Inks uses the depth of the formation, which is found by measuring from the neckline to the Adam trough’s lowest point. If you extrapolate this % rise from the breakout point, you can see a possible goal around $73,000, which is close to Bitcoin’s all-time high.
Along with the research are insights from a number of technical indicators. Volume, which is shown at the bottom of the chart, shows an enormous spike when the Adam bottom forms, followed by a quiet phase during the Eve phase. This is a pattern that is often linked to confirmation of a bullish mood.
Momentum is measured by the Relative Strength Index (RSI), which is currently at 47. This means that neither bulls nor bears have complete control. On the other hand, the Stochastic RSI, which is a sensitive sign of momentum, is above 95 out of 100, which means that conditions are overbought and there may be a short-term pullback.
Even though the Stochastic RSI’s overbought crossover suggests that there might be a decline, most people are still optimistic because of the Adam and Eve formation’s bullish pattern.

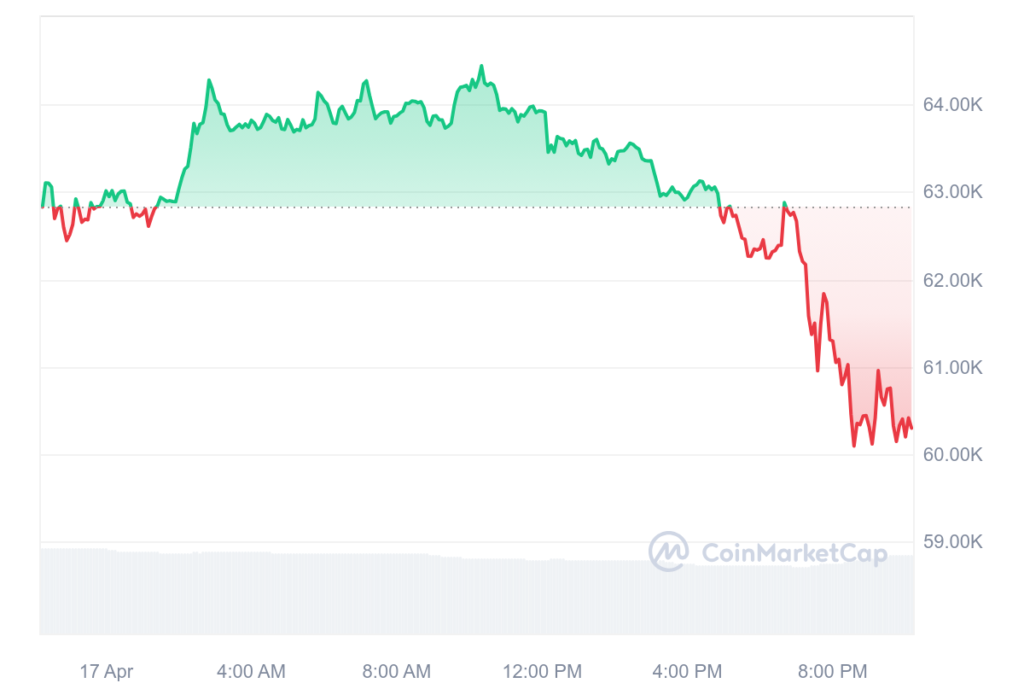
If Bitcoin goes over $67,000 and stays above it, the all-time high at $73,780 could be the next goal for bullish momentum. Bitcoin is worth $63,571 at the time of this writing.


