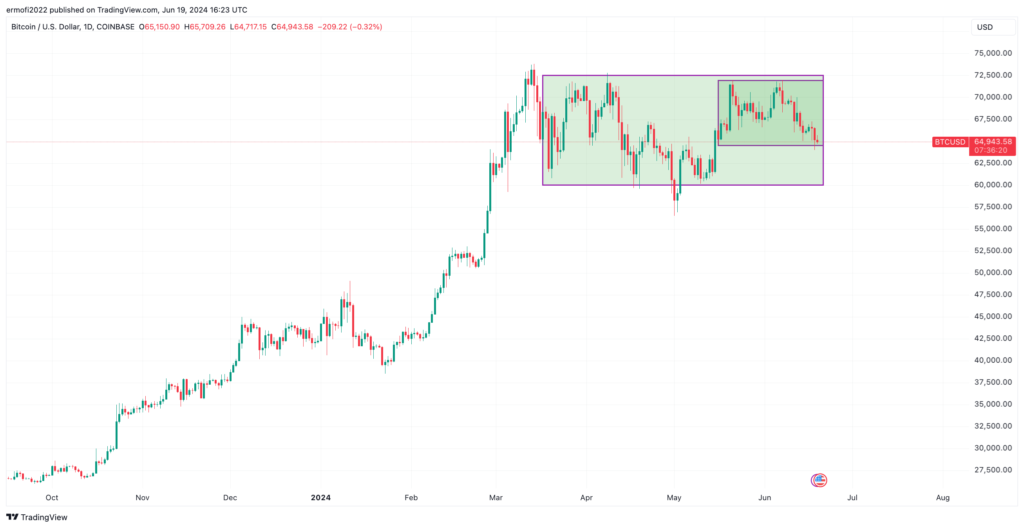
People who want to buy Bitcoin won’t give up, so the price has been going down. For almost a week, it has been moving back and forth between $55,000 and $58,200. No one has been able to break through the 200-day exponential moving average (EMA) at $58,000, which is a strong support point.
According to data from TradingView, Bitcoin is currently selling at $57,841, up 0.36%. Lower selling volumes suggest that the price will remain stable for a while.

The price of Bitcoin went below the 200-day exponential moving average (EMA) on July 4. This happened because the German government kept selling and people were waiting for Mt. Gox to pay back their debts. A number of tries to take back this level have failed to start a larger price trend. Jelle, an independent trader and expert, says that Bitcoin has been “chopping” below this “key SR area” for seven days now.
As Daan Crypto Trades wrote on X on July 11, “Bitcoin is making good progress along the roadmap.” The company said that Bitcoin had taken back $56,500, which was a key level to keep to avoid “danger for more immediate downside.”
FireCharts shared by trade resource Material Indicators show that when the price dropped below the 200-day EMA, Bitcoin whales bought into a block of ask liquidity below this level. Material Indicators said that a strong spike above this level would show that buyers are strong.
Bitcoin Whales Accumulate Amidst Market Stability Signals
Bitcoin whales don’t seem to care about the recent drop in value; they see it as a chance to add to their stocks. The independent trader Ali Martinez shared data from Glassnode that shows the Bitcoin Accumulation Trend Score is at 0.444.
This means that buyers are buying more Bitcoin. The Accumulation Trend Score shows how big the entities are in terms of how many BTC they hold that are constantly accumulating coins on the blockchain. A score of positive means buildup and a score of negative means distribution.
Glassnode’s data shows that almost all groups are moving from distribution to accumulation. This change is similar to a pattern of buildup seen in October 2023, before Bitcoin’s huge jump from $25,000 to $49,000, which was caused by the start of spot Bitcoin exchange-traded funds.

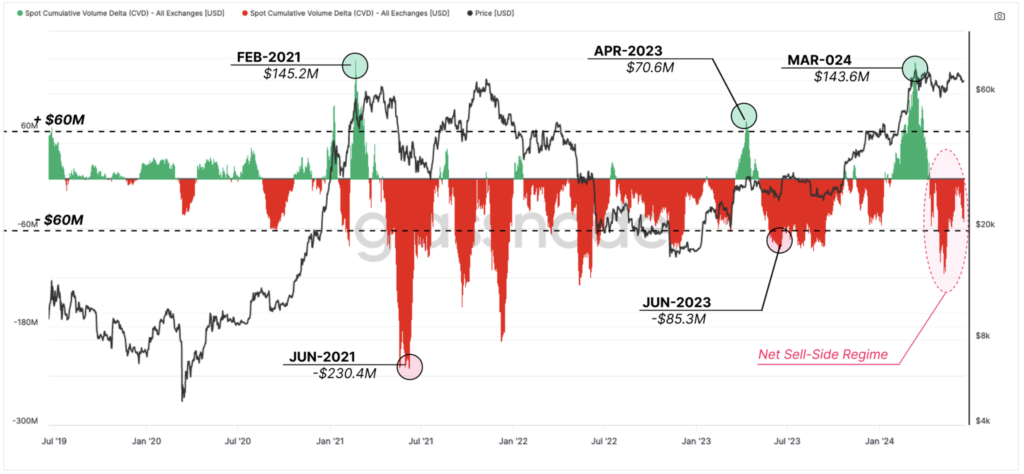
CryptoQuant data backs up this accumulation. It shows that money pouring into accumulation addresses hit a high point on June 10, after Bitcoin fell below $54,000. The fact that big buyers are buying more Bitcoin shows that they don’t plan to sell, which will make the market less volatile.
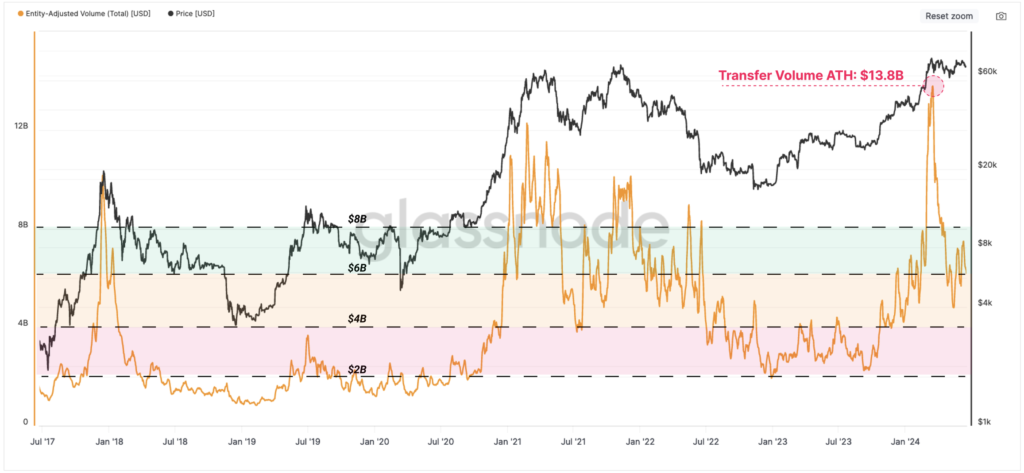
When looking at Bitcoin’s history, its instability is still at its lowest point. CryptoQuant shows that trading has slowed down overall since April. This is because people who are taking profits are waiting for a bigger rise to happen. As of July 11, the Bitcoin historical volatility measure was 8.86, which is a long way below its peak of 42.7 in 2021.

In the Bitcoin market right now, all of these things show that the price seems to be stuck in a small range. But things can change quickly, so people in the market should keep a close eye on on-chain measures to stay up to date.


