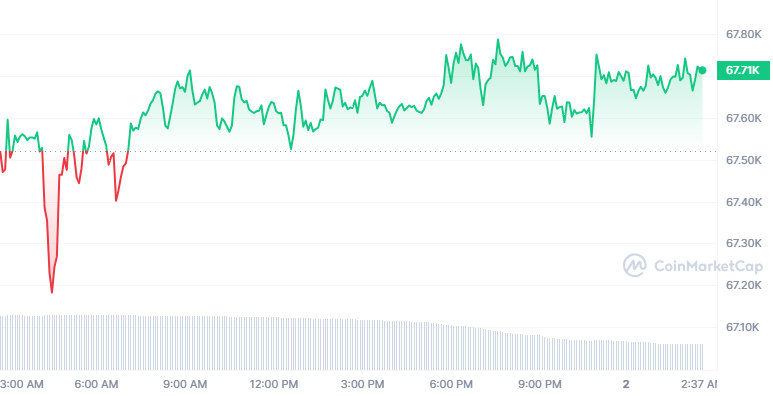
After failing to rise above the $72,983 barrier, Bitcoin’s price has kept declining. The bitcoin has plummeted from $71,942 to $66,785, presently trading below the Simple Moving Average (SMA on both the 1-hour and 4-hour charts). Remaining above the SMA, This fall might point to a turn toward a bearish trend.
BTC is valued at roughly $67,635 at the time , with just 0.14% rise. Although the 24-hour trading volume surpasses $25 billion, the market capitalization is at over $1.3 trillion. Still, both numbers have dropped: 1.14% for one statistic and 6.07% for another over the past 24 hours.

Potential Bitcoin Bearish Trend
Bitcoin’s decline below the simple moving average seen on the 4-hour chart points to a possible downward slide. With histograms below the zero line and the MACD line moving below the signal line, the 1-hour Moving Average Convergence Divergence (MACD) also shows a negative perspective.
Bitcoin’s price on the one-day chart is almost equal to the simple moving average over 100 days. With histograms below the zero line and MACD lines converging towards the zero line, the 1-day MACD likewise shows a bearish trend. These signals from both periods point to a possible major decline in Bitcoin, therefore initiating a bearish trend.
With main support levels at $60,146 and $50,604, Bitcoin presently faces a strong resistance level at $73,203. Should the price move bearish, it might gravitate towards the $60,146 support level. A breach below this could see it testing the $50,604 support threshold. Should BTC surpass the $60,146 and $50,604 supports, there exist further support levels below $67,635 that might be tested.
On the other hand, should BTC fail to go below these support levels, it might recover and target the $73,203 previous resistance level. Rising beyond this threshold could start a fresh movement and maybe bring fresh highs.


