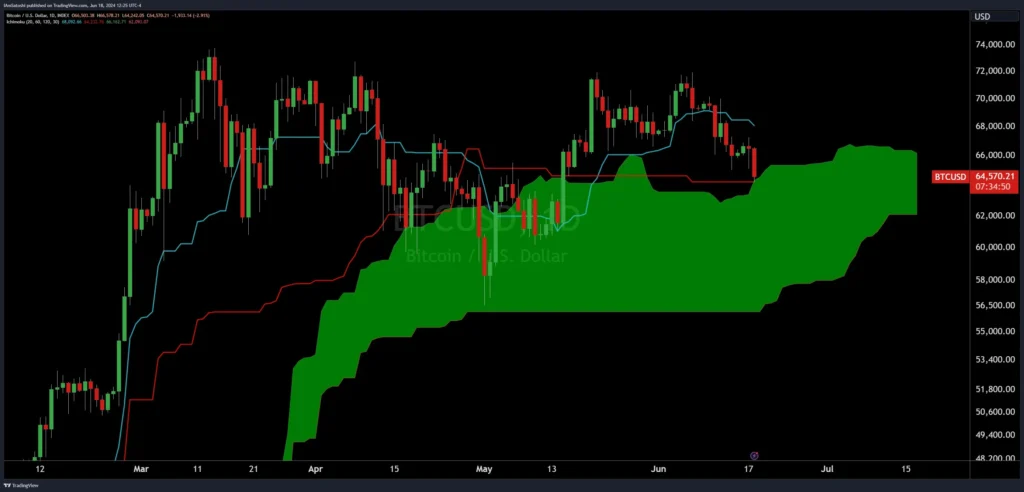
Using two important technical analysis frameworks—the Ichimoku Cloud and Bollinger Bands—famous crypto expert Josh Olszewicz has made a very important prediction about the near future of Bitcoin’s price. Olszewicz says that these tools show important turning points that could have significant impacts on Bitcoin’s path in the next few to medium terms.
In his analysis, Olszewicz points out the daily Ichimoku Cloud chart and a key moment for Bitcoin as it moves through this complicated signal. As of right now, Bitcoin trade is close to the edge of the Ichimoku Cloud, which shows levels of support and resistance as well as momentum and trend direction. This point is very important because a break above the cloud could mean that the trend is going up, while a drop below it could mean that the trend is going down.

Bitcoin Faces ‘Do Or Die’
This is a “do or die” situation for Bitcoin, according to Olszewicz. Bitcoin is getting close to the edge of the cloud; its price was last seen at $64,570. “No one likes an ultimatum, but it’s do or die here pretty soon on the daily BTC cloud,” Olszewicz said.
The Tenkan-Sen (red line) and the Kijun-Sen (blue line) are two important parts of the Ichimoku Cloud chart. The Tenkan-Sen, which is a shorter-term moving average, is currently higher than the Kijun-Sen, which is a longer-term moving average. This means that there is short-term positive momentum.
Olszewicz talks about another possible turning point by looking at the weekly picture with Bollinger Bands. Bollinger Bands are a way to measure volatility. Narrow bands mean that volatility is low, while more expansive bands mean that volatility is high. These bands are getting tighter around the current price level on the Bitcoin chart. This is called a “Bollinger Band Squeeze,” and it usually happens before major price changes.
At $64,238, Bitcoin is just above the midline (the 20-period moving average) of the Bollinger Bands. This shows that there is a delicate balance between forces to buy and sell. The narrowing of the bands stands out because it could cause a clear breakout or breakdown, depending on the market and how traders feel.

If Bitcoin falls below the middle line, the next level of support could be at the lower Bollinger Band, which is around $51,792. This means that the price could go down. If Bitcoin, on the other hand, bounces off the midline and starts moving up, it could aim for the upper Bollinger Band, which is around $76,684, which would mean a possible recovery.
Olszewicz stresses how important it is for traders to understand what a Bollinger Band Squeeze means because times of low volatility often end with major price changes. Olszewicz said, “If you didn’t like the Cloud ultimatum, here are the weekly BBands.”
Even though they were made with different analytical tools, both maps show the same thing: Bitcoin is likely at a turning point that will affect its price for the next few days or weeks. The market is very tense right now because prices are close to the upper limits of both the Ichimoku Cloud and the Bollinger Bands.


