
Many cryptocurrencies have returned to their monthly support levels in June, which was a very bearish month for the market. While these were going down, Ethereum’s price dropped the most, from a high of $3887 to a low of $3232, a 16.9% drop.
Even though there was a drop, it was within a healthy Fibonacci retracement, which suggests that Ethereum bulls may be getting ready for a comeback.A new lower high formed at $3975 in late May shows that Ethereum’s short-term trend will stay sideways.
Ethereum ETFs Launch July
This change shows that there is a lot of extra supply from sellers in the market, which means that buyers of ETH will need some time to get back on track. By connecting the above-mentioned points to a trendline, a possible triangle shape can be seen.
This shape is supported by a rising trendline that has been in place since October 2023.With a market cap of $407.3 billion and a price of $3389, ETH could go down even more if supply pressure stays high. If the price drops by 5%, it may look for support at the long-term trendline.
But new buying pressure from this trendline could push Ethereum up by 14–15%, testing the upper limit of the triangle at $3860. If this pattern breaks out in a bullish way, it means that the rise will continue.
A well-known crypto analytics company called IntoTheBlock recently brought up an important fact: long-term users own 78% of Ether. Even though the price of Ethereum is fluctuating, this steady rise in long-term purchases shows that people are very confident in its future value.
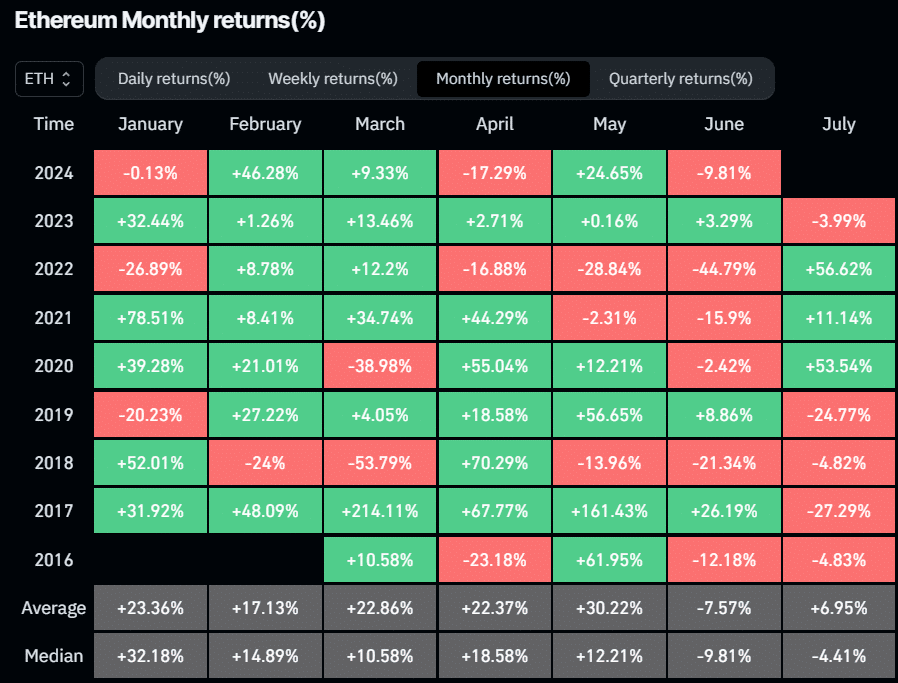
In the past, Ethereum’s price has had a range of results in July, which is a reflection of how investors feel about the market as a whole. The most it went up was +56.62% in July 2022, and the most it went down was -27.29% in 2017. The average return for July has been +6.95%, but the median return is -4.41%, showing that success has been mixed.