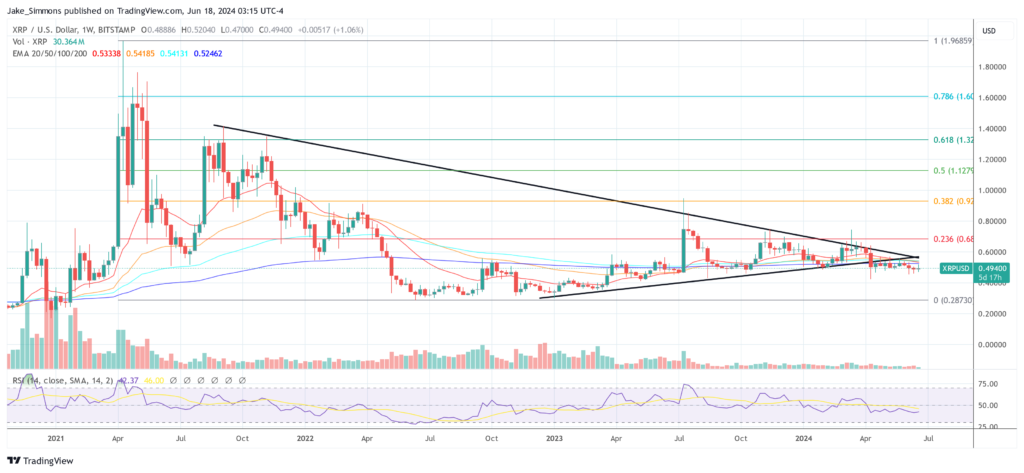
Crypto expert @Cryptobilbuwoo0 recently shared a chart analysis on X that makes a strong case for a possible XRP rally, comparing it to the total market capitalization of all cryptocurrencies. The analyst talks about important technical signs and historical patterns that show XRP could be about to enter a major bullish phase.
The XRP/Total chart shows a downhill trend that began at the high point in early 2018 and is made up of lower highs that are connected by a steady downward trendline. Notably, @Cryptobilbuwoo0 refers to the “Bounce Back Line,” which is a horizontal support line that has previously caused big price changes for XRP. The chart shows that Ripple has sharply gone back up several times after hitting this line.
XRP Approaching Support Level
The last important event that happened with the “Bounce Back Line” was on December 28, 2020, when XRP went from $0.18 to $2, a rise of over 1,100%. Before, on February 27, 2017, XRP went from being worth just under $0.02 to $3.35 in just 10 months. Right now, Ripple is getting close to this support level again, which makes the expert think that there will be another big rally.

The study also looks at the Relative Strength Index (RSI) and the Wavetrend Indicator (WT Krypt), which are important tools for figuring out how the market is moving and whether it might change direction. The 14-day RSI is getting close to 31 and is now in the oversold area, which usually means it’s time to buy or the trend is changing. In the past, similar RSI values have happened at the same time as the “Bounce Back Line” and significant price increases.
The Wavetrend Indicator, which shows when price cycles begin and end, also sends out bullish signs. When Ripple hits a new low but the indicator doesn’t, this is called a bullish divergences. This means that the negative momentum is weakening. The recent crossing of the Wavetrend lines (red over blue) is usually seen as a bullish opening signal, meaning that the price could go up.
The chart also shows how prices have moved in the past, pointing out areas and patterns like bullish divergences, as well as important trading zones and expected changes in the direction based on past data. These notes show that similar situations in the past have caused significant price increases, which supports the current bullish view.
According to @Cryptobilbuwoo0’s analysis, XRP is ready for a possible breakout since its price is at a historically important level and is being backed by bullish indicator signals. With the RSI getting close to oversold levels and the Wavetrend Indicator sending out positive signs, history suggests that a big rally might be coming soon, which backs up the analyst’s view.
Looking at the XRP/Total chart, XRP has always risen significantly from the rebound line. Indicators are also calling the bulls. XRP always moves alone like a maverick. XRP’s showtime begins.


