As the week began, Ripple [XRP] prices were unstable, which caused a major shift in the market’s mood as more traders sold short against the cryptocurrency.
This trend could be seen in XRP’s derivative readings, which showed that traders were becoming more pessimistic.Coinglass’s study of Ripple’s Funding Rate showed this change in the way the market works.
The Weighted Funding Rate for XRP started out at 0.0097% on July 7th, but it dropped sharply and was below zero by the end of the day, ending the day at -0.0046% at press time.
XRP Traders Turn Bearish
The change from a positive to a negative Funding Rate showed that buyers were losing power and sellers were gaining it. A negative Funding Rate basically means that short sellers are ready to pay more to keep their trades open because they think the price of Ripple will go down even more.

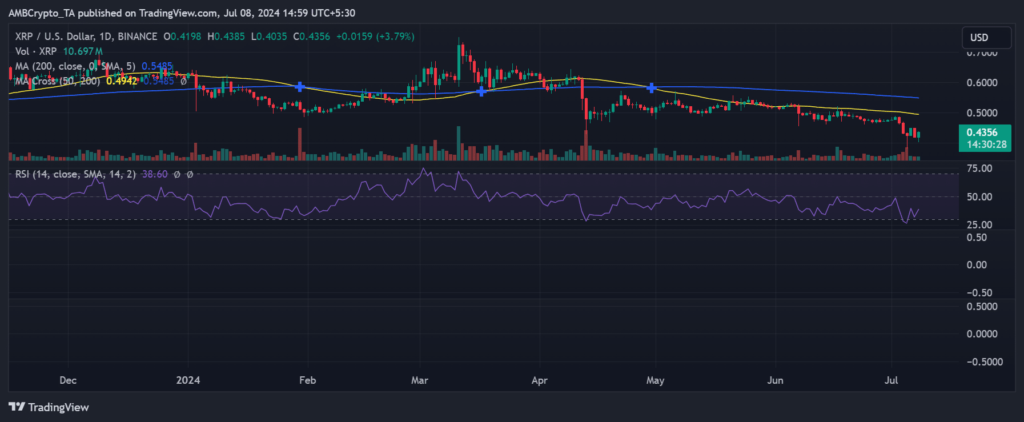
It was clear that traders were feeling pessimistic about XRP’s short-term price recovery because the number of short trades was growing. This change could be understood by looking at Ripple on a daily time frame picture.
When the week started, the price of Ripple was going down. By the end of trade on July 7th, it had dropped by a large 6.65%, reaching about $0.41. As of this writing, XRP has started to recover. It is now selling at around $0.43, which is more than a 3% rise.
On the other hand, this recovery has made people wonder if the current price rise will last. Traders and investors are still being careful because of the volatility and the new trend toward short selling.The daily time frame picture showed that XRP was still going down, which was supported by the Relative Strength Index (RSI).

At the time of publication, Ripple’s RSI was below 40, which shows that the price is going down and suggests that the asset may be facing a lot of selling pressure. Moving averages, which are usually shown as yellow and blue lines on a chart, were also moving above the present price.
The moving averages act as resistance levels that could stop any price rebound, so this pattern usually means that the market is going down. The fact that these averages are above the price makes it seem like the falling trend is still strong.


