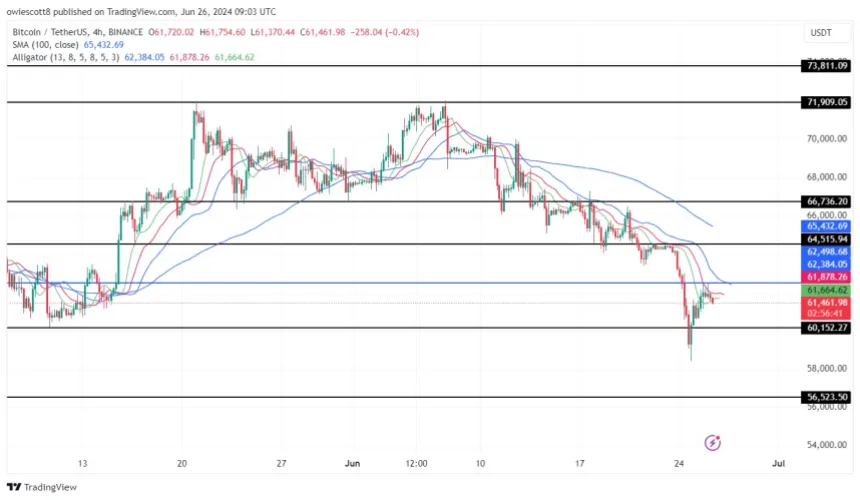
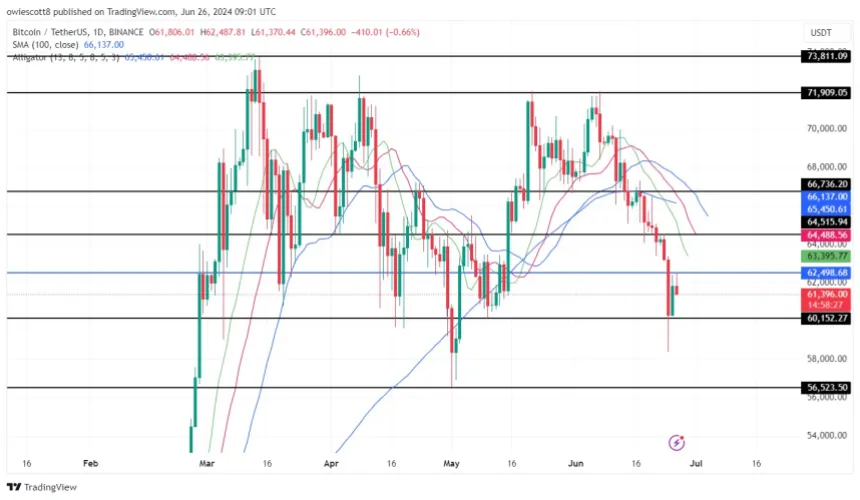
At $62,498 Bitcoin had a lot of problems. It was clear that the market as a whole was negative. It failed to break through this important level, which indicates that there is a lot of selling pressure. This makes people fear that trends may be going down.
After this rejection, traders and buyers are being extra careful. This has made market strategies look at their plans again as the bearish trend continues. Some possible outcomes for Bitcoin’s price path are being looked at by analysts, along with the impacts these outcomes will have on the cryptocurrency market as a whole.
Bitcoin’s Price Movement And Forecast
As of the most recent report, Bitcoin has a market value of more than $1.2 trillion and trades worth more than $27 billion. At the moment, the price of the coin is about $61,582, which is a small 1.2% rise.
Bitcoin is still falling on the 4-hour chart, which shows that it is selling below the 100-day Simple Moving Average (SMA). The latest rejection at $62,498 (shown on the chart as a blue line) shows that the price is still going down.

Technical indicators, like the 4-hour William Alligator, show that BTC downward trend may continue, with no immediate signs of a turn upward. In the same way, the 1-day chart shows that people are still bearish after multiple rejections at the $62,498 mark.

The study says that if the current trend of going down continues, Bitcoin could drop even more and test support levels at $60,152 and $58,523. Though, if Bitcoin goes up from the support level at $60,152, it could go as high as $64,515 or even higher, but only if it breaks through key resistance levels.

The mood on the market stays bad as BTC goes through key price levels. This changes major trends in the world of cryptocurrencies.


