


The XRP market closed January on a bearish note, posting a 7.05% loss over the past week. Analysts now observe a crucial inflection point for the altcoin, with equal potential for an upward surge or further decline.
On February 1, crypto analyst Egrag Crypto noted in an X post that XRP’s recent downturn led to a retest of two key technical levels: the 21-day Exponential Moving Average (EMA) and the lower boundary of a symmetric triangle.
XRP Whales Trigger Sell-Off
The EMA is a widely used trend-confirmation tool, where a drop below the EMA suggests bearish momentum, while trading above it indicates bullish strength. Simultaneously, the symmetric triangle pattern suggests a period of price consolidation before a decisive breakout.
Currently, XRP hovers near the 21 EMA line and the lower boundary of the symmetric triangle, around $2.93. Analysts caution that a break below this level could push XRP down to $2.83, a historically strong support zone. If bearish pressure intensifies, the price may plummet further to $2.40.
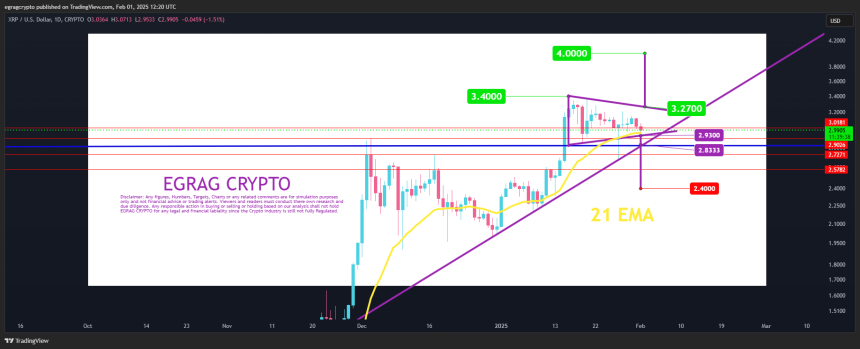
Conversely, a breakout above the upper boundary of the triangle could trigger a rally toward $4, with both scenarios carrying equal probability, according to Egrag Crypto. Adding to market uncertainty, crypto expert Ali Martinez reports that XRP whales have offloaded 70 million tokens worth $204.4 million within the last 24 hours.
This high-selling activity suggests bearish sentiment, as large holders seek to secure profits or hedge against potential declines. Retail investors may brace for continued short-term losses unless significant buying pressure emerges.
At press time, XRP trades at $2.93, reflecting a 3.10% daily decline, with a 12.60% drop in trading volume to $4.06 billion. Market participants now await further developments to determine whether Ripple will break out of its current consolidation phase or succumb to further downward pressure.


